Monitor
Monitoring network operations and performance is an important part of maintaining a healthy, stable, and secure ecosystem. By default, Substrate nodes provide low-level telemetry components to automatically collect and transmit detailed information about the operation of each node in the network. The backend telemetry information is streamed in real time—as it occurs—to an endpoint so that you can observe, monitor, and alert on system behavior.
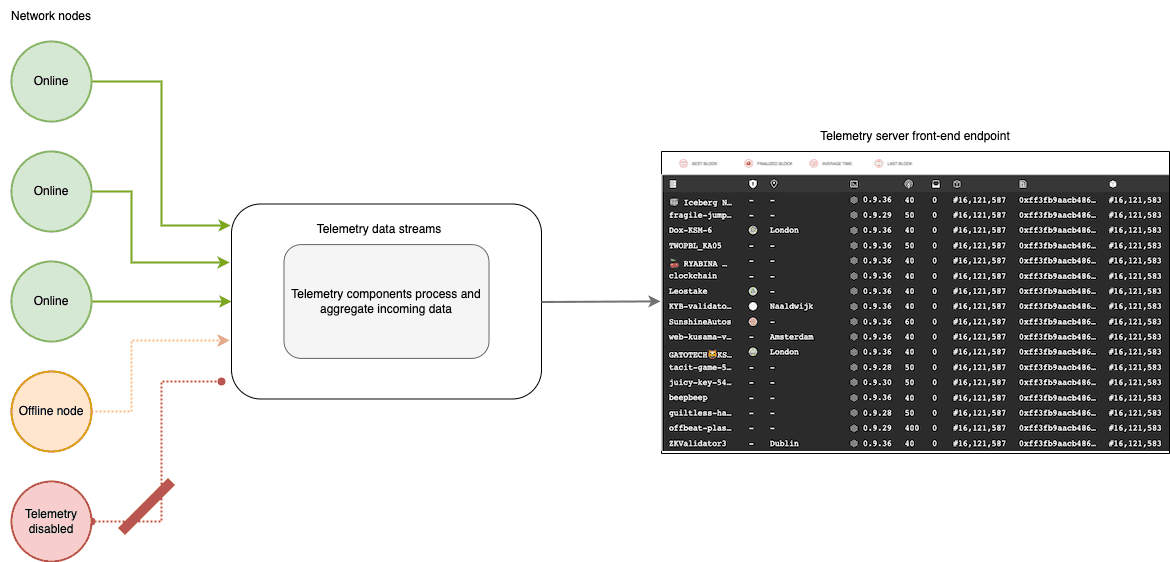
As a developer or node operator, there's rarely any need to know the implementation details of how these low-level telemetry components provide information about computer and network operations. At a high level, the information collected from each public node is sent to a default telemetry server and aggregated for display in a front-end dashboard.
The following diagram provides a simplified overview of the workflow.

View telemetry data
The Polkadot telemetry dashboard provides a real-time view of how currently online nodes are performing. You can choose the information you want to display by turning visible columns on and off from the list of columns available.
To see the list of columns and modify which columns are displayed, click Settings.

The columns you can toggle on and off include:
- Validator to display an indicator to differentiate validator nodes from other nodes.
- Location to display the location of a node.
- Implementation to display the version of the software running on the node.
- Network ID to display the public network identifier for the node.
- Peer Count to display the number of peers connected to the node.
- Transactions in Queue to display the number of transactions in the Ready queue waiting for a block author.
- Upload Bandwidth to display a graph of recent upload activity in MB per second.
- Download Bandwidth to display a graph of recent download activity in MB per second.
- State Cache Size to display a graph of the state cache size in MB.
- Block to display the current best block number for the node to ensure it's staying synchronized with its peers.
- Block Hash to display the block hash for the current best block number for the node.
- Finalized Block to display the most recently finalized block number for the node to ensure it's staying synchronized with its peers.
- Finalized Block Hash to display the block hash for the most recently finalized block number for the node.
- Block Time to display the block execution time between blocks.
- Block Propagation Time to display the time it took for the node to import the most recent block.
- Last Block Time to display the time it took for the node to author the most recent block.
- Node Uptime to display the number of days the node has been online without being restarted.
Pin node information
You can keep the information for one or more nodes in view in the dashboard by clicking the line displayed for the node in the dashboard list. For example, if you want to keep the information for two nodes visible while the information for other nodes scrolls by, you can select the nodes in the list and pin the information in place.

Display nodes on a map
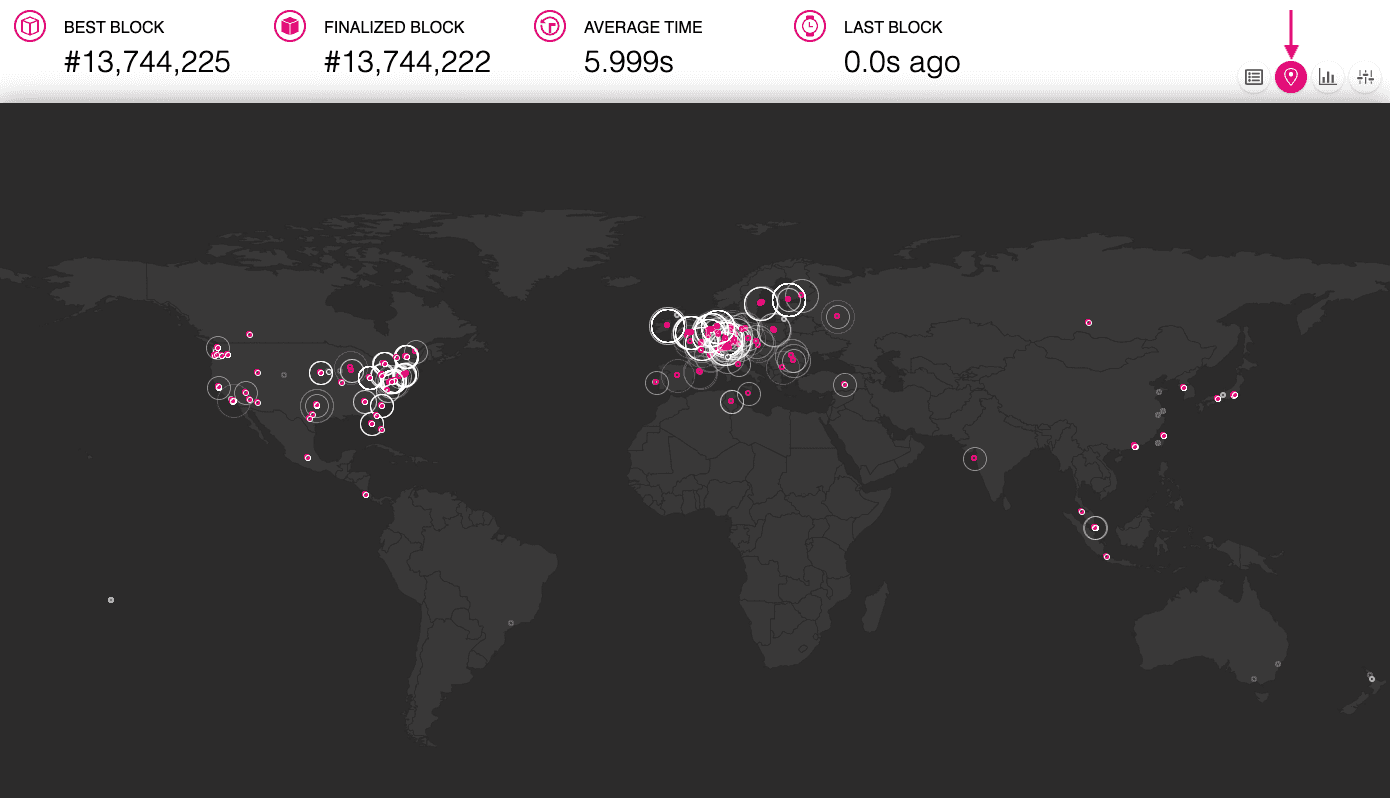
As an alternative to the list of nodes, you can display nodes on a global map. The map provides a visual representation of where nodes are located, where blocks are being produced and imported in real time, and where there are higher concentrations of nodes geographically. Note that only nodes that have a known location are displayed in the map.
To see represented on a map, click Map.

In this view, you can hover over any node location on the map to display a subset of the information available for the node, including the node name, location, best block number, best block hash, and block time statistics.
Display node statistics
In addition to the information available for individual nodes, you can view statistics that describe the number and percentage of nodes that share specific attributes. For example, you can see the percentage of nodes that are using each release of Polkadot, the percentage of nodes using the Linux operating system and the most common distributions currently deployed. You can also view statistics about the CPU and memory configuration across nodes in the network.
To see the full set of statistics available, click Statistics.

The statistics available include details about the hardware and software running on the nodes in the network, including:
- Software version.
- Operating system.
- CPU architecture and model.
- Number of physical CPU cores.
- Total memory.
- Whether the node is a virtual machine.
- Linux distribution and kernel version.
- CPU and memory speed.
- Disk speed.
Filter by chain
By default, the telemetry dashboard displays information about Polkadot and provides quick links to a subset of other chains. To display information for other chains, click More and select a different chain.

Customize the monitoring stack
The default telemetry dashboard provides visibility into node and chain operations without requiring you to host or configure any backend monitoring or front-end services. However, many projects choose to augment or replace the default telemetry server with their own backend server and front-end dashboards.
In general, setting up your own telemetry server involves establishing monitoring and alerting policies for both on-chain events and individual node operations.
On-chain activity
You can monitor on-chain activity for specific events, such as transactions submitted from a certain address, a change to the current validator set. On-chain monitoring typically involves connecting to RPC nodes to check for specific values, identify processing delays, or track the timing of events. In most cases, you only need two RPC instances to handle requests for all of your hosts. However, it's recommended that you run your own RPC servers to service these requests in case there are issues with the public RPC nodes. Some examples of applications that query on-chain information are polkabot and polkadot-basic-notification.
Node operations
You should monitor each node that you run on the network for basic information about its operation such as the current block height, the number of peer-to-peer connections, CPU usage, and the available free memory.
By default, Substrate exposes many useful metrics on the host:9615/metrics endpoint.
For example, if Substrate is running locally, you can see the metrics on the http://localhost:9615/metrics endpoint.
This endpoint outputs metrics using a simple key-value format.
For example:
polkadot_database_cache_bytes 0However, keys can also include descriptive tags. For example:
susbtrate_block_height{status="best"} 136
susbtrate_block_height{status="finalized"} 133
By default, the metrics endpoint is only be exposed on the local network interface.
However, you can expose it on all interfaces by using the --prometheus-external command-line option to start a node.
Configure monitoring tools
To set up monitoring and alerting policies, you typically configure a set of tools to create your own monitoring stack.
For example, the default metrics endpoint doesn't include host metrics—such as CPU, memory, bandwidth usage—so you can complement it by installing the Prometheus node_exporter on each host.
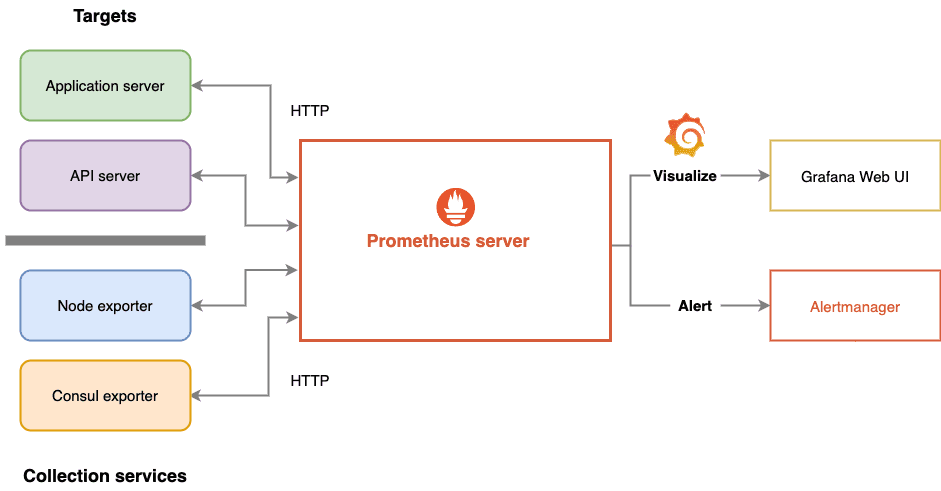
The following diagram illustrates an open source set of tools that are often used as a monitoring stack.

As this diagram illustrates, there are different tools available for each layer of the stack. In this example, the following tools are configured for monitoring on-chain activity and node operations:
- Prometheus is a monitoring engine that collects metrics from specified targets at specified intervals and evaluates the data collected using rules you define. Its time series database can hold large amounts of data that can be accessed very quickly.
- Grafana is an observability platform that allows you to query, visualize, and analyze the data you collect through dashboards and graphs.
- Node exporter is process that listens on a port and reports application-specific metrics to Prometheus.
- Alertmanager is a tool that enables you to create and route alerts based on the rules you specify. Alertmanager allows you to configure how and where to send alert if something goes wrong. For example, you can send instant messages for warning alerts, but page an on-call technician for critical alerts
- Loki is a scalable log aggregation system that allows you to view and search logs from all components in your infrastructure in one place.
For a simple example of setting up node monitoring using Prometheus, Grafana, and node exporter, see Monitor node metrics. For a simplified example of using Loki, see Remote logging.
Change the telemetry server
After you have configured the backend monitoring rules for your nodes, you can use the --telemetry-url command-line option when you start a node to specify the telemetry server that you want to send telemetry data to.
You can pass this option multiple times to specify multiple telemetry endpoints.
If you specify the --telemetry-url command-line option, you must also specify how verbose metrics should be, with level 0 denoting the least verbose through level 9 denoting the most verbose.
For example, to specify your own telemetry server URL with a verbosity level of 5, you would run a command similar to the following:
./target/release/node-template --dev \
  --telemetry-url "wss://192.168.48.1:9616 5" \
  --prometheus-port 9616 \
  --prometheus-external
For more information about the backend components for telemetry or configuring your own server, see substrate-telemetry or the telemetry helm chart for Kubernetes deployments.
Disable telemetry
Telemetry is enabled for all global chain nodes by default.
You can use the --no-telemetry command-line option to prevent a node from connecting to the Substrate telemetry server.
For example, to prevent telemetry data from being send to the default telemetry server, you would run a command similar to the following:
./target/release/node-template --chain myCustomChain \
  --no-telemetry