Monitor node metrics
Substrate exposes metrics about the operation of your network. For example, you can collect information about how many peers your node is connected to, how much memory your node is using, and the number of blocks being produced. To capture and visualize the metrics that Substrate nodes expose, you can configure and use tools like Prometheus and Grafana. This tutorial demonstrates how to use Prometheus to take data samples and Grafana to create graphs and dashboards to visualize the node metrics using the data samples.
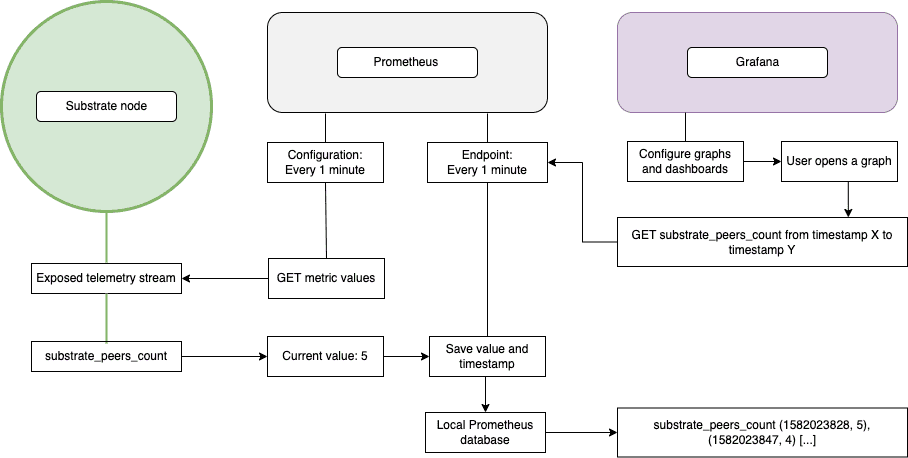
At a high level, Substrate exposed telemetry data that can be consumed by the Prometheus endpoint and presented as visual information in a Grafana dashboard or graph.
The following diagram provides a simplified overview of how the interaction between Substrate, Prometheus, and Grafana can be configured to display information about node operations.

Before you begin
Before you begin, verify the following:
- You have configured your environment for Substrate development by installing Rust and the Rust toolchain.
- You have completed at least some of the previous tutorials, including Build a local blockchain and Simulate a network.
Tutorial objectives
By completing this tutorial, you will accomplish the following objectives:
- Install Prometheus and Grafana.
- Configure Prometheus to capture a time series for your Substrate node.
- Configure Grafana to visualize the node metrics collected using the Prometheus endpoint.
Install Prometheus and Grafana
For testing and demonstration purposes, you should download the compiled bin programs for Prometheus and Grafana rather than building the tools yourself or using a Docker image.
Use the following links to download the appropriate binaries for your architecture.
This tutorial assumes you are using the compiled binaries in a working directory.
To install the tools for this tutorial:
- Open a browser on your computer.
- Download the appropriate precompiled binary for Prometheus from prometheus download.
-
Open a terminal shell on your computer and navigate to your Downloads folder, then run the appropriate command to extract the contents from the file you downloaded.
For example, on macOS, you can run a command similar to the following:
gunzip prometheus-2.38.0.darwin-amd64.tar.gz && tar -xvf prometheus-2.38.0.darwin-amd64.tar - Navigate to Grafana OSS download.
- Select the appropriate precompiled binary for your architecture.
-
Open a terminal shell on your computer and run the appropriate commands to install on your architecture.
For example, on macOS with Homebrew installed, you can run the following commands:
brew update
brew install grafana
Start a Substrate node
Substrate exposes an endpoint that serves metrics in the Prometheus exposition format available on port 9615.
You can change the port with --prometheus-port command-line option and enable it to be accessed over an interface other than the local host with the --prometheus-external command-line option.
For simplicity, this tutorial assumes the Substrate node, Prometheus instance, and Grafana service are all running locally using default ports.
- Open a terminal shell on your computer.
-
Change to the root of the node template directory, if necessary, by running the following command:
cd substrate-node-template -
Start the node template in development mode by running the following command:
./target/release/node-template --dev
Configure Prometheus endpoint
The directory created when you extracted the Prometheus download contains a prometheus.yml configuration file.
You can modify this file—or create a custom configuration file—to configure Prometheus to pull data from the default Prometheus port endpoint—port 9615—or the port you specified using the --prometheus-port <port-number> command-line option.
To add the Substrate exposed endpoint to the list of Prometheus targets:
- Open a new terminal shell on your computer.
- Change to the root of the Prometheus working directory.
- Open the
prometheus.ymlconfiguration file in a text editor. -
Add
substrate_nodeas ascrape_configendpoint.For example, add a section similar to the following:
# A scrape configuration containing exactly one endpoint to scrape:
scrape_configs:
  - job_name: "substrate_node"

    scrape_interval: 5s

    static_configs:
      - targets: ["localhost:9615"]
These settings override the global default values for scrape targets for the
substrate_nodejob. It's important to set thescrape_intervalto a value that is less than the block time to ensure that you have a data point for every block. For example, the Polkadot block time is six seconds, so thescrape_intervalis set to five seconds. -
Start a Prometheus instance with the modified
prometheus.ymlconfiguration file.For example, if you are currently in the Prometheus working directory and using the default configuration file name, start Prometheus by running the following command:
./prometheus --config.file prometheus.ymlLeave this process running.
-
Open a new terminal shell and check the metrics retrieved for the Substrate node by running the following command:
curl localhost:9615/metricsThis command returns output similar to the following truncated example:
# HELP substrate_block_height Block height info of the chain
# TYPE substrate_block_height gauge
substrate_block_height{status="best",chain="dev"} 16
substrate_block_height{status="finalized",chain="dev"} 14
substrate_block_height{status="sync_target",chain="dev"} 16
# HELP substrate_block_verification_and_import_time Time taken to verify and import blocks
# TYPE substrate_block_verification_and_import_time histogram
substrate_block_verification_and_import_time_bucket{chain="dev",le="0.005"} 0
substrate_block_verification_and_import_time_bucket{chain="dev",le="0.01"} 0
substrate_block_verification_and_import_time_bucket{chain="dev",le="0.025"} 0
substrate_block_verification_and_import_time_bucket{chain="dev",le="0.05"} 0
substrate_block_verification_and_import_time_bucket{chain="dev",le="0.1"} 0
substrate_block_verification_and_import_time_bucket{chain="dev",le="0.25"} 0
substrate_block_verification_and_import_time_bucket{chain="dev",le="0.5"} 0
substrate_block_verification_and_import_time_bucket{chain="dev",le="1"} 0
substrate_block_verification_and_import_time_bucket{chain="dev",le="2.5"} 0
substrate_block_verification_and_import_time_bucket{chain="dev",le="5"} 0
substrate_block_verification_and_import_time_bucket{chain="dev",le="10"} 0
substrate_block_verification_and_import_time_bucket{chain="dev",le="+Inf"} 0
substrate_block_verification_and_import_time_sum{chain="dev"} 0
substrate_block_verification_and_import_time_count{chain="dev"} 0
# HELP substrate_build_info A metric with a constant '1' value labeled by name, version
# TYPE substrate_build_info gauge
substrate_build_info{name="ruddy-afternoon-1788",version="4.0.0-dev-6a8b2b12371",chain="dev"} 1
# HELP substrate_database_cache_bytes RocksDB cache size in bytes
# TYPE substrate_database_cache_bytes gauge
substrate_database_cache_bytes{chain="dev"} 0
# HELP substrate_finality_grandpa_precommits_total Total number of GRANDPA precommits cast locally.
# TYPE substrate_finality_grandpa_precommits_total counter
substrate_finality_grandpa_precommits_total{chain="dev"} 76
# HELP substrate_finality_grandpa_prevotes_total Total number of GRANDPA prevotes cast locally.
# TYPE substrate_finality_grandpa_prevotes_total counter
substrate_finality_grandpa_prevotes_total{chain="dev"} 77
# HELP substrate_finality_grandpa_round Highest completed GRANDPA round.
# TYPE substrate_finality_grandpa_round gauge
substrate_finality_grandpa_round{chain="dev"} 76
...
Alternatively, you can open same endpoint in a browser to view all available metric data. For example, if you are using the default Prometheus port, open
http://localhost:9615/metricsin a browser.
Configure the Grafana data source
After you run the appropriate commands to install Grafana on your architecture, you can start the service on your local computer to begin using it. The commands used to start the service depend on your local system architecture and package manager. For example, if you are using macOS and Homebrew, you can start Grafana by running the following command:
brew services start grafanaFor information about starting Grafana on different operating systems, see the appropriate Grafana documentation.
After you start Grafana, you can navigate to it in a browser.
-
Open a browser and navigate to the port Grafana uses.
By default, Grafana uses http://localhost:3000 unless you have configured a different host or port.
- Log in using the default
adminuser name and passwordadmin, then click Log in. - On the Welcome page, under the Configuration menu, click Data Sources.
-
Click Prometheus to configure the Prometheus endpoint as the data source for Substrate node metrics.
With both the Substrate node and Prometheus instance running, configure Grafana to look for Prometheus on its default port
http://localhost:9090or the port you configured Grafana to use if you customized the port information.You shouldn't specify the Prometheus port you set in the
prometheus.ymlfile. That port is where your node is publishing its data. -
Click Save & Test to ensure that you have the data source set correctly.
If the data source is working, you are ready to configure a dashboard to display node metrics.
Import a template dashboard
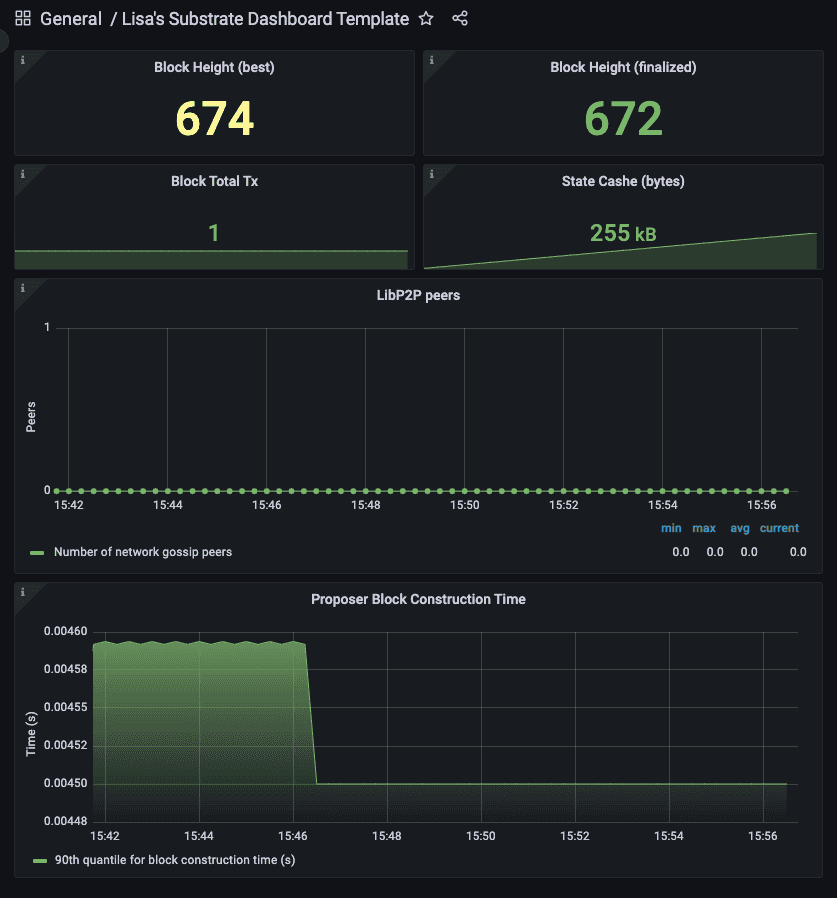
If you want a basic dashboard to start, you can import a Substrate dashboard template to get basic information about your node.
To import the dashboard template:
- On the Grafana Welcome page, click Dashboards.
- In the left navigation, click Dashboards and select Browse.
- For the Search options, click New and select Import.
- Copy the Substrate dashboard template and paste it into the Import via panel json text box.
- Click Load.
- Review and modify, if necessary, the name, folder, and unique identifier for the dashboard.
-
Select Prometheus (default), then click Import.
![Substrate dashboard template]()
The Substrate dashboard template can be used with any Substrate-based chain and is also available for download from the Grafana Labs dashboard gallery.
If you want to create your own dashboards, see the Prometheus docs for Grafana.
If you create a custom dashboard, consider uploading it to the Grafana dashboards. You can let the Substrate builder community know your dashboard exists by listing it in the Awesome Substrate repository.

